
The biggest and most well-known area of SAP auditing must be purchase-to-pay. Almost one third of our indicators fall into this category. That alone is reason enough for us to devote an extensive two-part blog series to the subject.
Before going into things in more detail, we first need to describe the fundamentals of auditing purchase-to-pay in SAP. In this article, we will start by outlining the changes in the audit process brought about by digitization, then take a look at the necessary data structure and finish by explaining the concept of indicators:
- Changes in the audit process
- The benefits of automated audit
- Purchase-to-pay data structure in SAP
- Financial Process Mining
- Dragnet investigation
- The concept of indicators
Changes in the audit process
When thinking of conventional ways of auditing purchase-to-pay, techniques such as interviews, or reviews of process documentations usually come to mind. Further consideration is then given to the corresponding risks and the internal control system so that the internal control system is put thoroughly to the test.
This traditional way of auditing costs a lot of time and money. Going down this path often leads to a good understanding of what the purchase-to-pay process should look like in theory, but this is not always then put into practice. Deviations are often not recognized.
The modern way of auditing purchase-to-pay processes looks very different. Empirical methods are used to identify risks. By using intelligent algorithms to analyze your SAP data, you can reconstruct your processes. On completion, different data indicators can be used to analyze actual process weaknesses. Every indicator can be associated to a certain step in the process. Based on the data at your disposal, a digitized process audit can be used to transpose the correct professional approach into a digitized audit methodology:
- First, the actual processes in your SAP are reconstructed by means of our algorithms
- Data analyses can then be performed to identify process weaknesses, pointing out weaknesses in the internal control system. This is done by using a set of indicators, each of which represents an audit question.
From 2010 to 2013, such a digital approach was developed by the Virtual Accounting Worlds research project, supported by the German Ministry of Education and Research (Bundesministerium für Bildung und Forschung – BMBF).

The benefits of automated audit
Extensive use of data and process audits in purchase-to-pay can lead to considerable gains in efficiency. The benefits for those involved include:
- Internal audit teams can efficiently audit the usual risks in purchase-to-pay and therefore spend more time on company-specific risks that are difficult to identify by automated data analysis.
- Independent auditors can make findings about the internal control system based on automated data and process analysis.
- Audit employees have to spend less time on manual tasks such as data extraction, documentation and data evaluation, meaning they can focus more closely on exercising their professional judgement with regard to their findings. In short, this means: More time for auditing!
Purchase-to-pay data structure in SAP
Before we go on to explain the connections between SAP data, a list of the necessary SAP tables is shown below:
- EKKO:Purchasing Document Header
- EKPO:Purchasing Document Item
- EBAN:Purchase Requisition
- BKPF:Accounting Document Header
- BSEG:Accounting Document Segment
- LFA1:Vendor Master (General Section)
- LFB1:Vendor Master (Company Code)
- LFBK:Vendor Master (Bank Details)
Relations to accounting
Certain documents in accounting point to documents in purchasing. Such accounting documents are usually vendor invoices and receipts of goods. In such cases, the position of an accounting document (BSEG table) within the data field EBELN (purchase document number) refers to the document header of a purchase order (EKKO table). You can read more about the reconstruction of processes in the section on “Financial Process Mining”. Before we can reconstruct the processes however, we need to extract the necessary data from our SAP system. So how is this done?
Extracting data from your SAP system
Extracting data from your SAP system is not that easy. There are various tools on the market which allow for data extraction from SAP systems. But usually an ABAP program needs to be installed in order to receive data. In many companies, this is a “show-stopper” because transactions into a SAP system often require a Change Management Process. This can take a long time, due to the various authorization steps involved.
Another possibility is to manually download single tables from the SAP system. This can be done using transactions such as “SE16(N)” or “SQVI”. This involves a lot of manual tasks however and can be a very cumbersome process.
The third option is working with Remote Function Calls (RFC). Only a user account with corresponding user rights is needed in order to call up RFC components. Thus, an ABAP program is not required. Compared to other techniques, RFC is pretty old and sometimes slow. It is however an established method that is available in every SAP system in the world. RFC can thus be a convenient and effective way of optimizing data extraction, and can be used to extract data for analysis from SAP systems with relative ease . This may take some time initially, but it is time well spent. You can easily reuse this kind of extraction method for subsequent audits.
Financial Process Mining
Before we start to take a look at the different indicators, it is first worth noting a few points regarding the audit approach.
Before various data analyses can be conducted, all processes that led to a single posting in the financial statements need to be reconstructed. These also include all processes related to purchasing. This procedure is performed by means of the Financial Process Mining algorithm. The Financial Process Mining algorithm is able to find all the processes in your SAP system by segmenting related documents successively until the process is complete.
Documents are connected to each other when a document has balanced the open item of another document. In this way, goods received are often balanced by the incoming invoice and the incoming invoice by the associated outgoing payment.
The Financial Process Mining algorithm jumps from the goods received document to the associated invoice and then to the associated payment. These documents are then connected together in a so-called sequence. By following this approach, all sequences can be reconstructed for further analysis using indicators.
You can find out more about how the Financial Process Mining algorithm works here: “Basic Principles of Financial Process Mining – A Journey through Financial Data in Accounting Information Systems”.
Once all documents in the accounting system have been found and connected together in sequences, orders and order requests, as well as all change documents, are added to the sequences.
Dragnet investigation
When all sequences have been reconstructed by the Financial Process Miningalgorithm, a so-called dragnet investigationis performed.
A dragnet investigation means that a test is performed for every document to establish whether it has “triggered” an indicator or not. If an indicator is relevant to a document, the indicator is attached to that document.
All tested documents are connected together in sequences. By means of the dragnet investigation, it is therefore possible to determine whether a sequence is “affected” by several indicators. Thanks to the sequences reconstructed in the first step, combinations of indicators which are relevant to your SAP processes can be determined. The following illustration shows how a sequence has been “tagged” with indicators (Caution: German language):
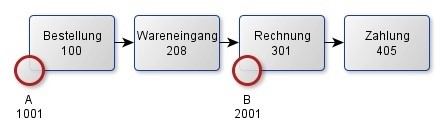
The illustration shows four documents (Purchase Order (100), Goods Receipt (208), Invoice (301) and Payment (405)) in a simple purchase-to-pay process. Purchase Order 100 has been tagged with the finding 1001 and the invoice has been tagged with the finding 2001. Indicator A might therefore be “Missing payment terms in your purchase order document” and indicator B might be “A locked vendor has been used”.
The concept of indicators
Indicators always correspond to an audit-relevant audit question. Technically, they are database queries which pick out documents from the database that meet certain predefined criteria.
Broadly speaking, it is simply a case of performing some straightforward data analytics.
Nevertheless, an indicator must be defined in such a way that it always and exclusively targets a given number of individual documents. In other words, it has to be possible to analyze all documents in a database and determine whether or not the indicator is relevant to a document or not in all cases (the indicator can be used to arrive at a “black-and-white” classification of all documents).
Once the indicator has “run through” all sequences, all the relevant documents “affected” are “marked” for this indicator.
To make it easier to navigate between indicators, there are several dimensions to every indicator. Every indicator belongs to exactly one process and to a certain process area, and has a certain audit objective, such as:
- Process dimension: purchase-to-payables, order-to-cash, fixed assets and inventory, cross process
- Process area dimension: master data, receipt of goods, inventory, payment, etc.
- Audit objective dimension: compliance and correctness, restricted access, opportunities for savings, process standardization
Furthermore, a risk is documented for every indicator, indicating what could potentially “go wrong” or to what extent a certain kind of risk may exist.